It's a familiar moment in a schedule review. Someone asks the scheduler: "What if the switchgear turns up three weeks early — how much does that pull Practical Completion in?" Ten minutes later, someone else asks the same about a different free-issued item. Both items show Total Float = 0. Both are on the critical path. The honest answer to "which one should we chase harder?" usually isn't in the schedule at all.
Total Float tells the room which activities control the finish date. It doesn't tell anyone how much each one is controlling it. That's the gap Critical Path Drag closes — a concept Stephen Devaux formalised in Total Project Control.
For the planner: Total Float identifies which activities are driving the finish date. Drag quantifies how much each of those activities is driving it — the schedule return, in days, on compressing that specific activity.
For management: Total Float tells you which activities are holding the project up. Drag tells you which one to put money and effort into first, and exactly how many days that investment actually buys.
Below is a worked example: a 220kV switchyard, a transformer lead time that would make anyone wince, and a BESS installation that can't energise until the substation does.
A quick primer
Total Float = 0 means an activity has no room to slip without delaying the finish date. It says nothing about how much delaying it further would cost, or how much shortening it would gain.
Drag is the amount of time an activity is adding to the project duration — equivalently, the maximum time the project would finish earlier if that activity took no time at all. Formally:
Drag = min( Duration, improvement in finish date when the activity is shrunk to zero )
Three properties follow from that definition:
- Only critical activities have Drag. Anything with float > 0 has Drag = 0 by definition — shortening it doesn't touch the finish date.
- Drag never exceeds an activity's own duration. You can't gain 60 days by compressing a 20-day activity.
- Drag is capped by the tightest competing downstream float — not necessarily the nearest one. Compress an activity far enough and some parallel path becomes the new controlling constraint; past that point, further compression buys nothing. This is what makes Drag differ from duration, and it's where the useful information lives.
To calculate it without P6 or Microsoft Project's own engine: zero-and-remeasure. Shrink a critical activity toward zero, re-run the forward pass downstream of it, measure how far the finish date moved, restore it, repeat for the next one.
Worth remembering: if an increase in a critical activity's duration can push Practical Completion out, a decrease in that activity's Drag is what pulls it in.
An Example Project — Simplified BESS & Substation Build
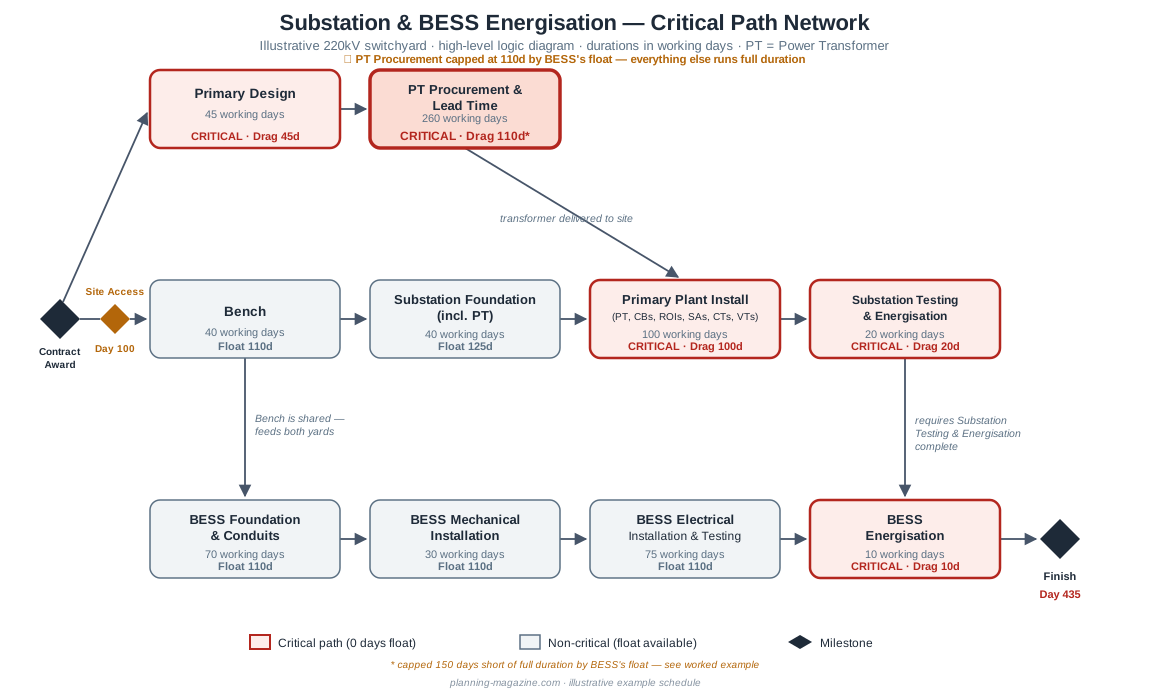
Three parallel paths, feeding two energisation milestones. Bench — site establishment — is shared between both yards, and can't start until a Site Access milestone on Day 100 (landowner agreements, easements, whatever's holding it up). Design and procurement don't need site access to happen.
- Substation build — Bench → Substation Foundation (PT plinth, CB pads, isolator pads, structures) → Primary Plant Installation (PT, CBs, ROIs, SAs, CTs, VTs) → Substation Testing & Energisation
- Transformer procurement — Primary Design → PT Procurement & Lead Time (feeds Primary Plant Installation)
- BESS installation — Bench → BESS Foundation & Conduits → BESS Mechanical Installation → BESS Electrical Installation & Testing → BESS Energisation (requires Substation Testing & Energisation)
Running the numbers
| Activity | Path | Duration | Early Start | Early Finish | Total Float |
|---|---|---|---|---|---|
| Bench (shared, after Site Access) | Substation + BESS | 40 | 100 | 140 | 110 |
| Substation Foundation (incl. PT) | Substation | 40 | 140 | 180 | 125 |
| Primary Design | Procurement | 45 | 0 | 45 | 0 |
| PT Procurement & Lead Time | Procurement | 260 | 45 | 305 | 0 |
| Primary Plant Installation (PT, CBs, ROIs, SAs, CTs, VTs) | Substation | 100 | 305 | 405 | 0 |
| Substation Testing & Energisation | Substation | 20 | 405 | 425 | 0 |
| BESS Foundation & Conduits | BESS | 70 | 140 | 210 | 110 |
| BESS Mechanical Installation | BESS | 30 | 210 | 240 | 110 |
| BESS Electrical Installation & Testing | BESS | 75 | 240 | 315 | 110 |
| BESS Energisation | BESS | 10 | 425 | 435 | 0 |
Project finish: Day 435, driven by a 260-working-day transformer lead time — roughly 12 months, not an exaggeration right now. Five activities show Total Float = 0. By float alone, they're indistinguishable.
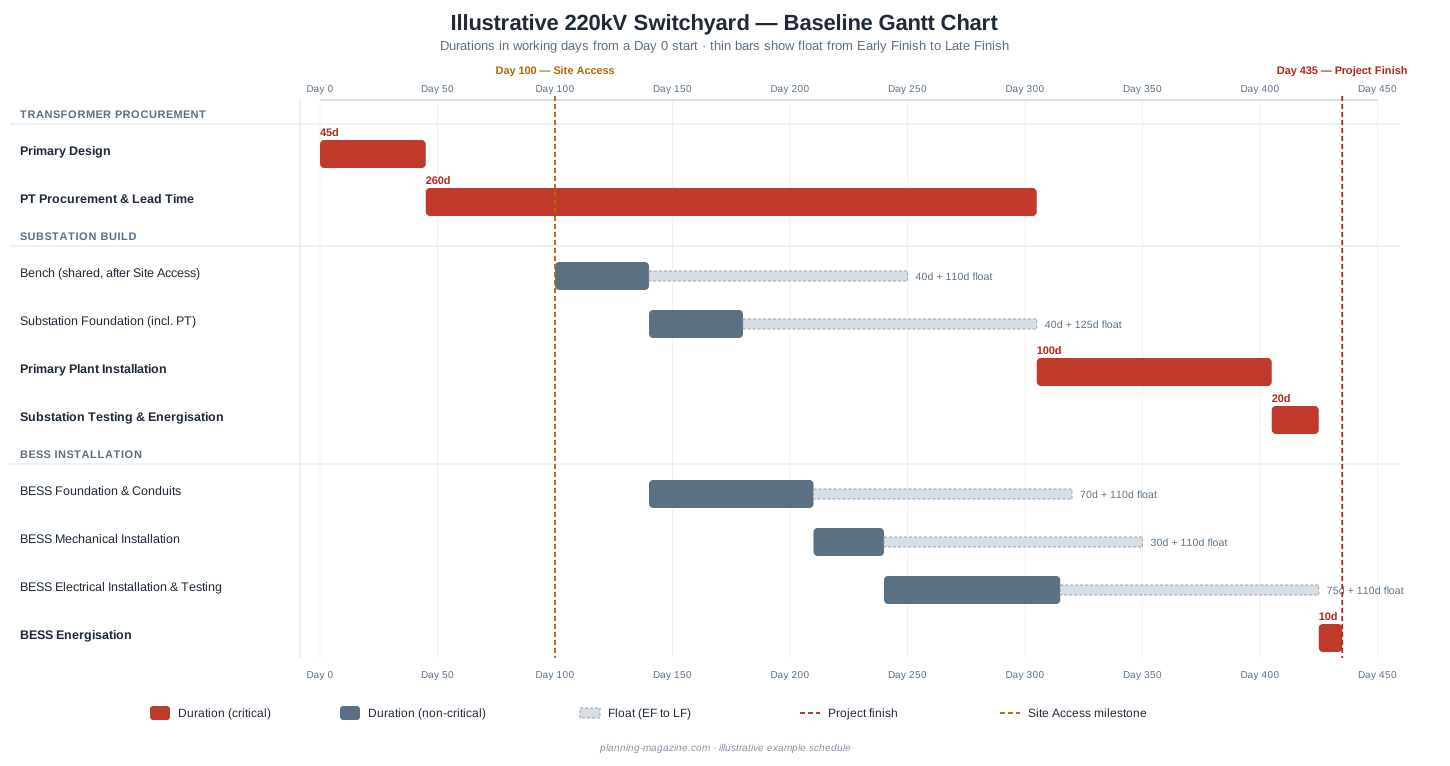
The critical chain along the top is an unbroken run of red with nothing trailing it. Everything else — Bench, Substation Foundation, the BESS chain — drags a float tail behind it.
Where Drag changes the story
| Activity | Duration | Total Float | Drag |
|---|---|---|---|
| Primary Design | 45 | 0 | 45 |
| PT Procurement & Lead Time | 260 | 0 | 110 ⚠ capped |
| Primary Plant Installation | 100 | 0 | 100 |
| Substation Testing & Energisation | 20 | 0 | 20 |
| BESS Energisation | 10 | 0 | 10 |
Shrink PT Procurement toward zero and compression flows through Primary Plant Installation and Substation Testing day for day — until Substation Testing's finish comes within 110 days of the BESS chain's finish (Day 315, fixed, independent of the transformer). Past that, BESS Energisation's other predecessor takes over. Drag caps at 110 — 150 days short of full duration.
Everything else on the chain stays uncapped. Primary Design (45), Primary Plant Installation (100), and Substation Testing (20) all fit inside BESS's 110-day cushion, so nothing catches them before they run out. Only the activity whose own duration exceeds the tightest downstream float gets capped — here, that's PT Procurement alone.
Drag values sum to 285 — 150 short of the 435-day duration. That gap is exactly PT Procurement's own shortfall: the signature of a single capped activity in an otherwise-uncapped chain.
What if the transformer were available today?
| Lead time cut | New PT Procurement duration | New project finish | Days pulled in |
|---|---|---|---|
| 0 days (no change) | 260 | 435 | 0 |
| 50 days | 210 | 385 | 50 |
| 100 days | 160 | 335 | 100 |
| 110 days | 150 | 325 | 110 |
| 260 days (available immediately) | 0 | 325 | 110 |
Every day cut up to 110 pulls Practical Completion in 1:1. Past that, nothing — the BESS chain finishes Day 315 regardless of the transformer, and Substation Testing can't beat it.
So yes, chasing the transformer is worth it — but only up to 110 days. Beyond that, the money buys nothing, and no amount of expediting changes it. That ceiling is invisible on a float-only view of the schedule.
What this means on site
- PT Procurement & Lead Time — the standout lever, but capped at 110 of its 260 days by BESS's float. Worth chasing hard, right up to that ceiling.
- Primary Design, Primary Plant Installation, Substation Testing — no hidden caps. Full duration is genuine Drag; compress any of them and it shows up 1:1 at Practical Completion.
- BESS installation — 110 days of float, so compressing it gains nothing today. But it's not a bystander either: its float is what sets the ceiling on the transformer. Compress BESS later and that ceiling moves up.
- Total Float alone couldn't tell you any of this. All five critical activities read identical on that measure.
Drag isn't a column you can switch on
Neither Primavera P6 nor Microsoft Project calculates Drag out of the box. Both give you Total Float, Free Float and a critical flag — and stop there. Drag has to be derived separately: by hand on a small network like this one, or by running the zero-and-remeasure pass programmatically against an exported schedule.
That's a large part of why the metric stays niche despite being simple to define. It isn't difficult maths. It's just not a tick-box in the tools most planners already have open.
Closing
Total Float will always be the first thing anyone looks at in a schedule review, and rightly so — it answers a real question. But it only answers the first half of the question that actually gets asked around the table.
Five activities in this example carry Total Float = 0. On that measure they're identical. On Drag, they range from 10 days to 110 — an eleven-fold difference in what compressing them is worth. One of them has a hard ceiling that no amount of expediting can push past. None of that is visible until the numbers are run.
The practical takeaway is small: next time the question comes up — "what if this arrives early, how much does it help?" — there is a defensible number available, and it usually isn't the activity's duration.